Introduction
Comvix Equities is a suite of five tools for equity analysts, traders and portfolio managers. It’s built around using a combination of NLP and machine learning to classify corporate news from a very broad set of sources (50,000), with linkages to concurrent price movements (S&P 500 adjusted, beta=1). Two of the tools are intended for equity analysis, three for trading and portfolio management.
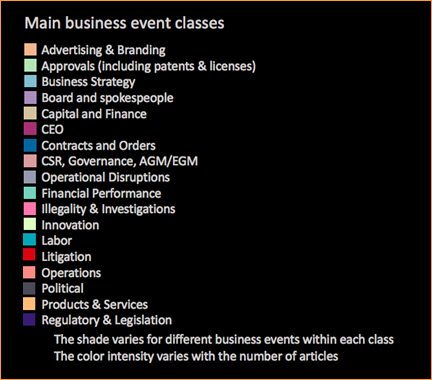
Comvix covers about 3,500 U.S. equities, since 1 January 2014. The business events taxonomy has 450 elements at the granular level and 18 main business event classes, shown below with their respective colors used in the charts.
One of the five tools, the Event-Trader, provides a good introductory demonstration how Comvix classifies business events.
Main Tools
Equity analysis
- The Multi-Day Chart facilitates price attribution analysis for equities. It shows what business events occurred in the context of coterminous changes in the stock price.
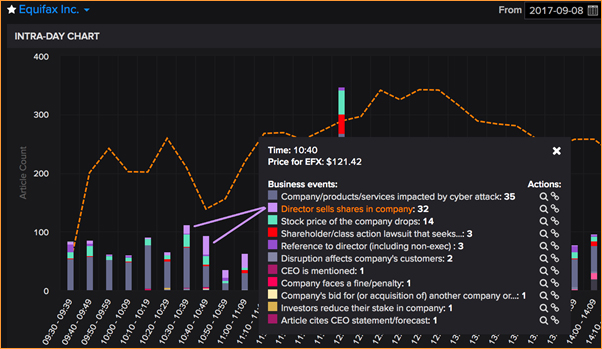
- The Intra-day chart shows the same, again historically, but with a time-granularity of 10 minutes.
Signals
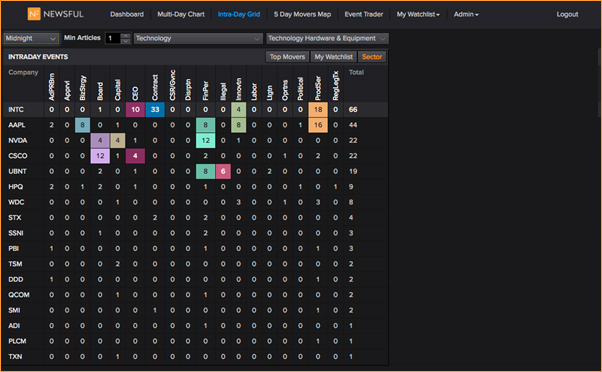
- The Intra-Day Chart Movers grid summarizes recent, current-day business events in a grid format of instruments and main business events classes. Each cell in the grid indicates the number of articles of recent coverage.
- The 5-day Movers Map shows a color map of instruments which have seen both a high level of coverage and a sharp change in their price over the prior 5 trading days.
-
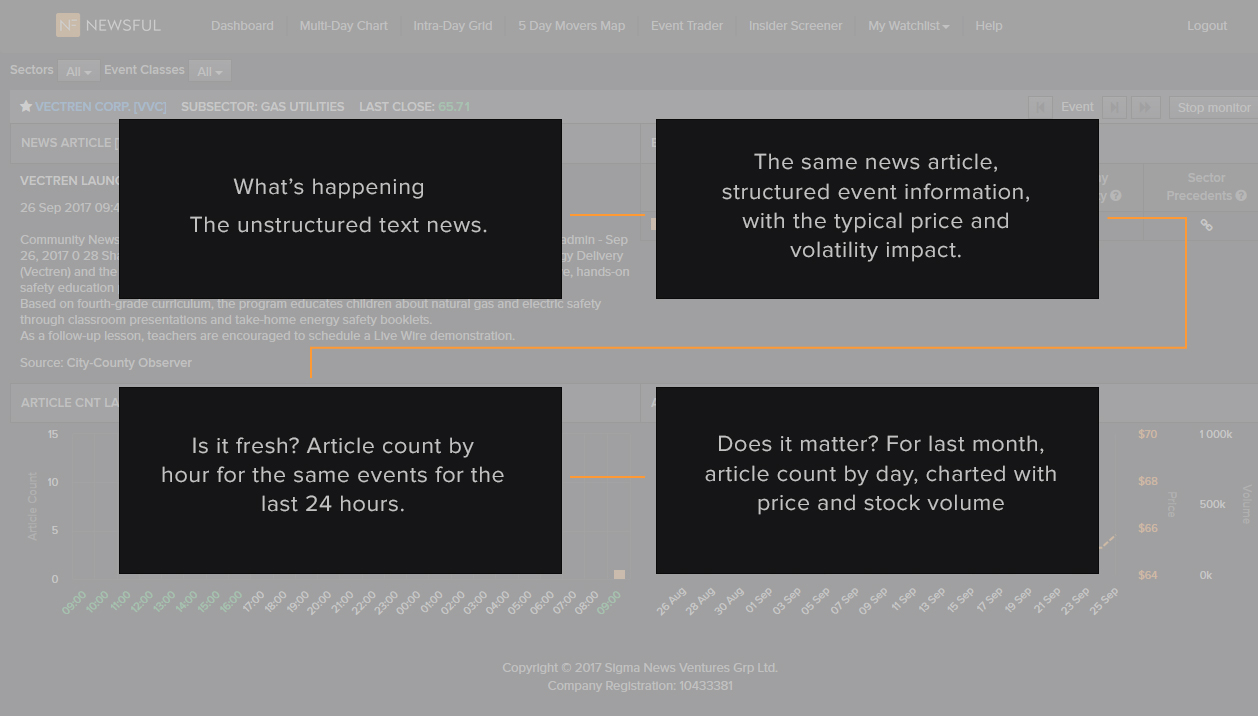
The Event-Trader monitors four streaming and interlinked information elements:
- The top left quadrant shows news article summaries (streaming, replaced automatically).
- The top right summarizes the business events detected in the article. Certain business events are on average followed by a significant subsequent rise or decline in the price. These are indicated in the chart. The return calculations are based on the mean, S&P 500 adjusted return between the first Open after the news, and the Closing of the third day, with beta=1. Only days with high coverage are used. Some business events tend to be followed – again over the following three trading days – by a rise in volatility. There is also a function to drill-down to precedents, similar business events in the same sector.
- The bottom-left quadrant shows a chart of the number of articles on the same business events for the same company over the last 24 hours. This answers the question, Is this new?
- The bottom right quadrant shows a chart of the number of articles on the same business events over the last month, along with the price-changes and the changes in trading volumes. This often answers the question, Does this matter?
Multi-day and Intra-day Charts
Benefits: These charts provide the fastest, most comprehensive and most accurate way for historical price-change attribution.
The Multi-Day Chart is a line-chart which shows the stock-price against the right axis. It superimposes as bars the count the number of articles on different business events, against the left axis. In the example below, based on the media coverage of the hacking of Equifax in September 2017, the number of articles is in thousands. Each color represents a class of business event and the legend can be found in the Introduction.
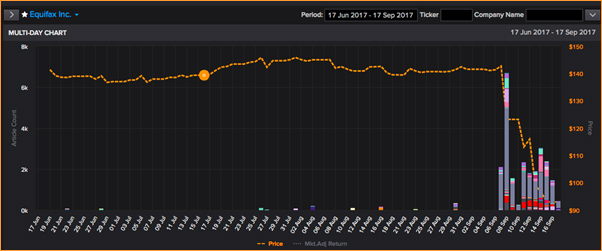
A more detailed breakdown of the events, and individual articles, can be obtained Individual by clicking to drill down on an individual day.
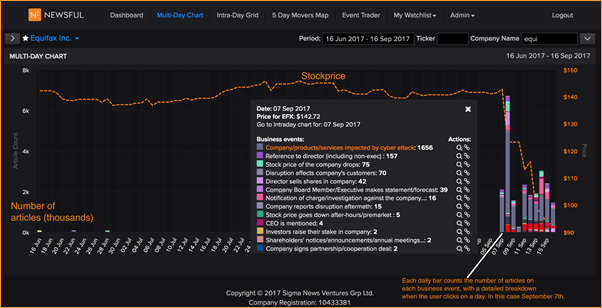
At the top of the menu for the daily breakdown is a link to drill into the intra-day coverage for the selected day.
Both the multi-day and the intra-day charts offer two functions for each business event. These two functions are represented with the icons:
![]()
The magnifying class allows the user to filter to just one specific business event. The chart is re-drawn, but with only that business event selected. This is useful to review prior coverage.
The link symbol allows the user to find similar business events within the same sector.
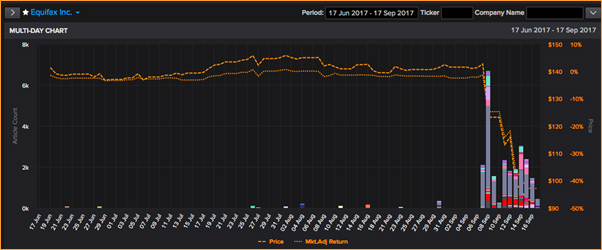
The dotted line shows the market-adjusted stock return, against the right axes. This is obtained by clicking on the Mkt.Adj. Return below the chart. Beta=1.
In the examples above, Equifax’s stock price had increased somewhat in the second half of July. However, that rise closely matched the movement of the S&P 500. On a market-adjusted basis the return was almost flat, until the news about the hacking in September.
Charts are available from 1 January 2014. The period covered can be changed by the user, but can be hard to read if based on more than four months of data.
The company in the chart can be changed by entering a ticker or the start of a company name and selecting from a drop-down menu.
Intra-Day Grid
Benefits: Keep track of your portfolio. Find trading ideas.
The Intra-day grid provides a summary of recent business events. The user can select the period covered. Each column represents one of the high-level business event classes. This table below shows the color-legend used in the grid.
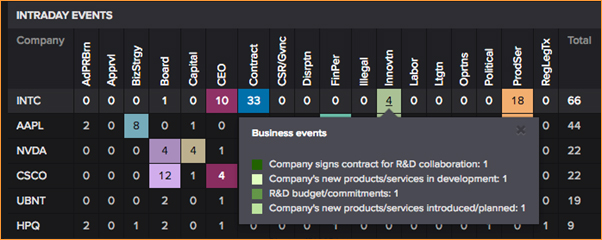
By holding the cursor over a cell, the user gets a summary of the business events:
The 5-Day Movers Map
Benefits: Find trading ideas. Examine attribution.
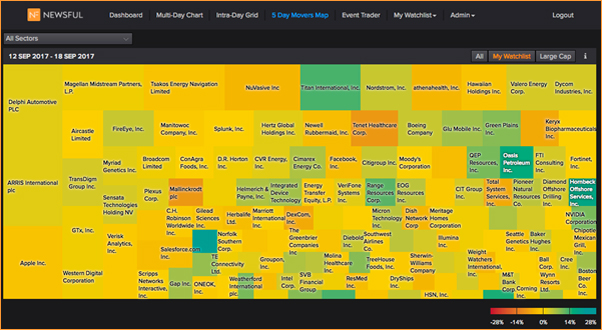
The color of each cell represents the stock return over the prior five trading days. The size indicates the level of media coverage on business events, over the same period. The size is determined relative to the average level of media coverage for the company over the last trading year.
By holding the cursor over a cell, the user obtains the specific values. In the case of Apple, the media coverage has been 3.8 times the average. The stock is down 1.75%, and 2.45% adjusted (S&P 500, beta=1).
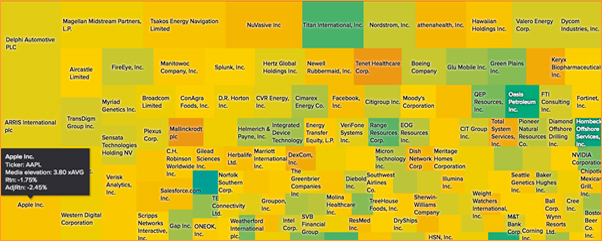
By clicking on a cell, the user is taken to the Multi-Day Chart, to examine the business events associated with the abnormal media coverage level and abnormal period return. The Multi-Day chart permits drill-down to the Intra-Day Chart.
Event Trader
Benefits: Trading Signals
The Event Trader provides actionable trading signals for human traders who trade on news. The tools of Event Trader are displayed in four quadrants. This inevitably used a good deal of screen space, but the user can reduce the size of the window.
For any human trader who fully or partially relies on news for trading ideas, Commetric’s Event Trader offers:
- Breadth of signal: Commetric’s Natural Language and Machine Learning engine tracks a thousand times more news sources (50,000) than an unassisted reader can.
- Alert: Event Trader never gets inattentive, or excited.
- Granularity: Event Trader identifies events with meaningful granularity. Precise enough to be directionally significant for price impact and risk. But not so granular that there are too few past observations to build a model or allow the user to drill into precedence data.
-
Benefits: More, smarter and lower risk trades:
- Identify fresh, tradable business events from the news.
- Determine if the event has already been reported / priced-in.
-
Determine the association between the business events and price/risk.
- Based on recent coverage for the specific company in question.
- Historical precedence for the same business event for all companies.
- Review and analyze – in detail - similar events for the same or other sectors.
Event Trader Example
Event Trader consists of four quadrants of information. In the example below, for Canadian Solar, we see news/announcement of an apparently significant contract, for 100 megawatt annually. That’s the top left quadrant. The top right quadrant is the structured event: COMPANY WINS CONTRACT. The top left quadrant tells us the information is pretty fresh. Nine articles in the last hour (08:00 to 09:00 New York time). No coverage before that in the last 24 hours. And no similar events for Canadian Solar in the last month.
After a significant contract win announcement, the stock price tends to rise over the next three days (average for all past observations, for all companies), but there is some extra price volatility.
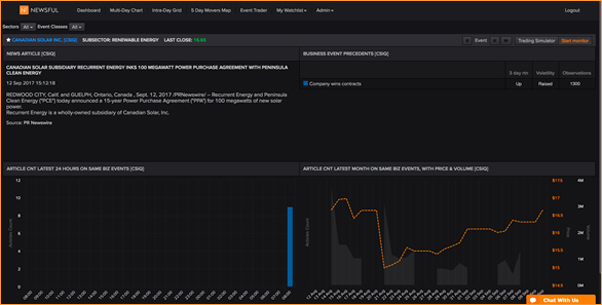
In this example, there were nine articles on the contract-win, all in the last hour. Unless you think the news is very, very significant, you should probably not trade on individual articles. A cluster of multiple articles, on the same event, indicates significance and drives more price impact than a single one. The average forward return is calculated specifically after news that created such significant event clusters.
Other
Sectors
We use a proprietary two-level sector taxonomy.
- Agriculture
- Apparel, Fashion, Clothes & Shoes
- Banking, Financial Insurance Services
- Business Services
- Chemicals
- Construction & Engineering
- Materials
- Energy
- Food, Beverages, Tobacco
- Health
- Household & Personal Goods
- Industrial
- Media
- Mining
- Real estate
- Retail
- Telecommunications
- Technology
- Transportation
- Tourism, Restaurants, Leisure
- Utilities
- Non-Governmental Organization
- Intergovernmental organizations
Stock returns
Unless otherwise indicated we generally use Close to Close, adjusted with the S&P 500 return, with a beta = 1.
Media Set
In the standard configuration, we draw on a 50,000-wide set of sources. Contact us if you want to include Thomson Reuters news, or proprietary sources for which you have the appropriate licenses.