How to Use
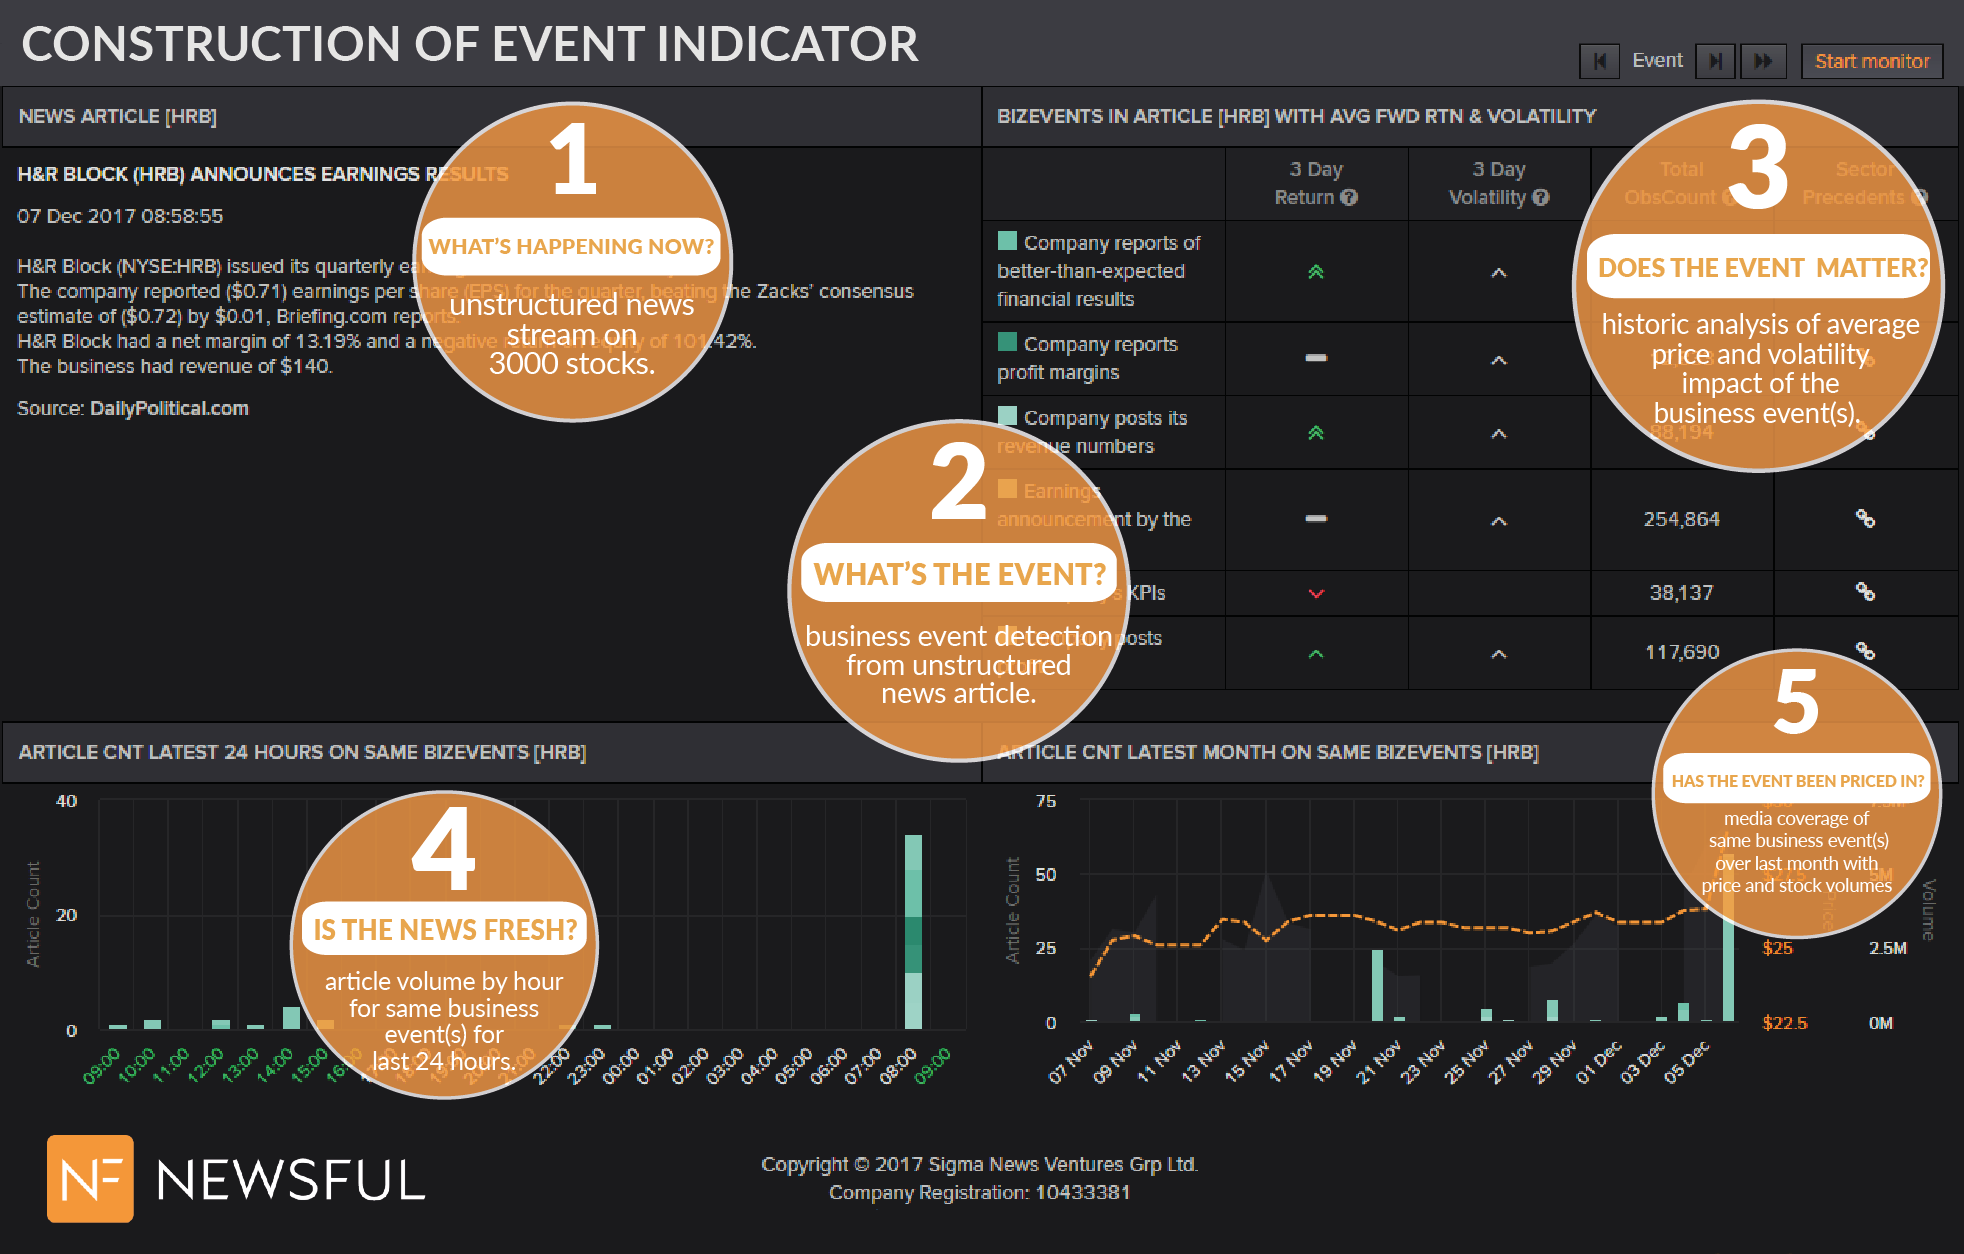
The Event Trader detects new trading opportunities. Comvix algorithms have mined a data decade of accurately time stamped corporate newsflow, to develop an index combining trillions of price data with billions of classified news articles. Event Trader opens up this data reservoir to offer traders indicative price movements for today’s real time news based on historic price movements and new saturation measures. Sharpen up your trading strategy today with Event Trader.
Unstructured data
We have scanned more than 2 billion articles for prominent references to publicly traded companies. The earliest articles are from 2001.
In the standard configuration Comvix includes news from 1 January 2014, drawn from a 50,000-wide set of sources. Contact us if you want to include Thomson Reuters news, or proprietary sources for which you have the appropriate licenses.
We have one of the largest databases of media meta data in the world. And we have good time-stamps, which allows us to link the news with stock price changes.
Company recognition
The challenge
Achieving precision in identifying a company name is not as easy as it sounds. Many companies have names that are similar, even identical, to those of other company names. Others have names that are also ordinary words, like Apple, Oracle and Amazon. In addition, the articles contain many different references to the same company (IBM, I.B.M., Big Blue, International Business Machines, or even SPSS, which is a subsidiary of IBM).
The solution
Natural language experts on our team have created dictionaries of safe and ‘unsafe’ company names. For the ‘unsafe’ ones we require a secondary reference, like a mention of a subsidiary or executive. In our hunt for unambiguous references to publicly trades companies we also take into account the grammar of the sentences; the verbs, the capitalization, the punctuation, and separating subjects and objects.
Business Event Recognition
The challenge
Hidden in the media articles are references to certain business events. Automatic and reliable identification of the business events opens up dimensions of exciting opportunities. For instance, what tends to happen to the stock price of a company – say, the forward 3-day market adjusted return – following the settlement of a labor strike.
We are hardly unique in realizing that there is great value in extracting such structured data from articles and then linking those data points with coterminous structured numerical data, such as stock prices.
There is an efficient, practical and cheap way to extract structured data about business topics from media articles. Almost all textual analyzers use that approach.
The practical approach uses statistical analysis of the frequency of words. For instance, say the word ‘strike’ appears in one of a 1,000 articles for Wal-mart over the last year, but one in 10 articles today. The frequency of the word ‘strike’ is at 100 times the usual level. Say the word ‘discrimination’ is also prominent, and you start to get some idea about the topic discussed. Armed with the frequencies it’s possible to use statistics and machine learning to get a good idea about the topics.
But, knowing the topics is not the same as discerning the business events. There is a big difference between “Nokia and Apple settle patent dispute” and “Nokia files patent claim against Apple”, though the topic is in both cases the same (probably something like “Litigation”).
The solution
There is a very expensive alternative way to extract structured data about business topics from media articles. Had we known how hard it is, we might not have chosen it, but that’s what we use. It cost us 150 man-years of development.
We have hand-developed more than 6,000 programmatical rules to identify not the topics, but the specific events. In our world, the start of a legal patent dispute is a completely different event than a settlement.
The 6,000 rules classify the media coverage of publicly traded companies by 450 distinct business events, one of the most granular taxonomies in the world. This classification achieves a high degree of precision, but we have refined it further by manually analysing about 1.5 million articles. That provides the basis for a machine learning layer.
The net result is the world’s most granular and precise classification of business events extracted from the world richest database of meta-data from media.
Event Trader Benefits
For any human trader who fully or partially relies on news for trading ideas, Commetric’s Event Trader offers straightforward and obvious practical benefits
- Breadth of signal: Commetric’s Natural Language and Machine Learning engine tracks a thousand times more news sources than an unassisted reader can.
- Workhorse: Comprehensive event extraction: Many articles contain references to multiple business events. Event Trader never gets inattentive, or excited.
- Granularity: Event Trader identifies events with meaningful granularity. Precise enough to be directionally significant for price impact and risk. But not so granular that there are too few past observations to build a model or allow the user to drill into precedence data.
-
Benefits: More, smarter and lower risk trades:
- Identify fresh, tradable business events from the news.
- Determine if the event has already been reported / priced-in.
-
Determine the association between the business events and price/risk.
- Based on recent coverage for the specific company in question.
- Historical precedence for the same business event for all companies.
- Review and analyze – in detail - similar events for the same or other sectors.
Trading Ideas
Event Trader consists of four quadrants of information. In the example below, for Canadian Solar, we see news/announcement of an apparently significant contract, for 100 megawatt annually. That’s the top left quadrant. The top right quadrant is the structured event: COMPANY WINS CONTRACT. The top left quadrant tells us the information is pretty fresh. Nine articles in the last hour (08:00 to 09:00 New York time). No coverage before that in the last 24 hours. And no similar events for Canadian Solar in the last month.
After a significant contract win announcement, the stock price tends to rise over the next three days (average for all past observations, for all companies), but there is some extra price volatility.
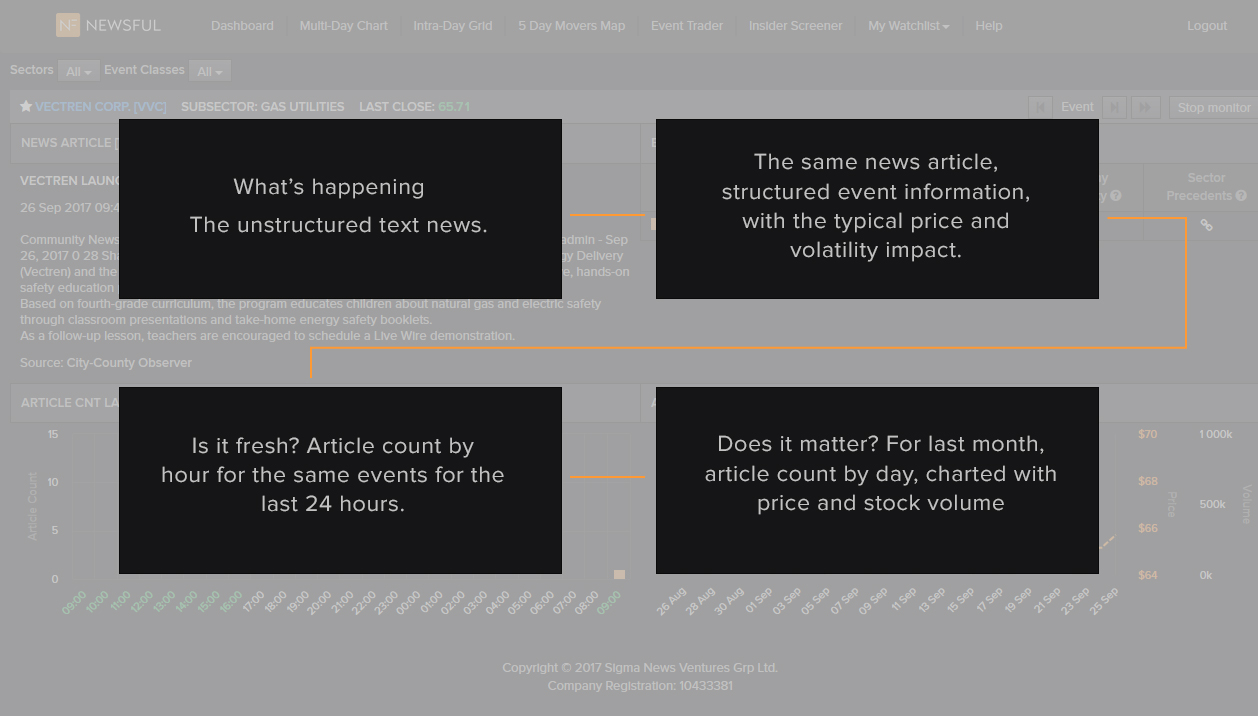
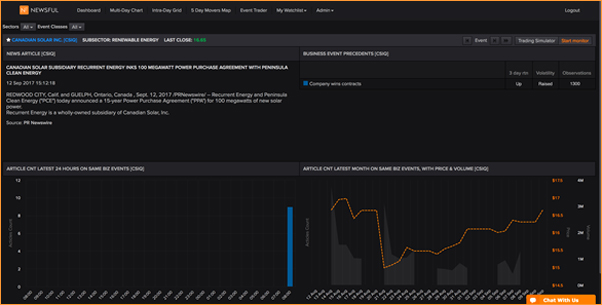
In this example, there were nine articles on the contract-win, all in the last hour. Unless you think the news is very, very significant, you should probably not trade on individual articles. A cluster of multiple articles, on the same event, indicates significance and drives more price impact than a single one. The average forward return is calculated specifically after news that created such significant event clusters.
Significant Event Cluster and Forward Return
Sophisticated traders will want to understand our procedure for identifying that a significant event has taken place, because it’s following such events that we calculate the historical abnormal, investable stock return.
During the trading hours information is dispersed and interpreted very quickly, in fact so rapidly that it’s not possible to identify a cluster of articles before the price-correction start.
Ergo, we get the most precise information by looking at news coverage clusters published when the markets are closed. The new information, published after close on a Monday, but before open on the Tuesday, can build into a multi-article cluster. The combined effect of that new information ( and dissemination ) is priced in at the next open.
The overnight return prices reflect the average market perception of the new information, relative to the previous closing price and the information that was available and priced in then.
Market adjusted returns
Note: By stripping out the S&P 500 price-move, we distil the effect of the corporate specific news events that we track.
All the prices we use are market-adjusted, for that reason. When we speak of a 3-day forward return, we also mean market-adjusted return.
Forward return
The price move during the night, in reaction to the news, is not practically investable. The earliest time you can get an order filled, is in the next open auction. The 3-day forward return is therefore the (market-adjusted) return from the next open until the closing auction on the third trading day. That is investible.
You can use the insights / average forward returns for quick-fire trading when the markets are open, too.
Significant Event Cluster
Would we regard the nine articles when Canadian Solar won a contract as a significant cluster? How many articles must be published for us to regards it as a significant event cluster?
That depends on the company. Nine articles overnight is a very small number for Apple, but a good many for Canadian Solar.
It also depends on the business event. Even for Apple, nine articles on a strike could be significant.
We needed a precise definition of Significant Business Event, but for that definition to be meaningful for all the companies and all the business event for each company.
Here’s how we identify the Significant Business Events.
For every company, we analyze every possible business event, for every day.
We build a table like this.
| Company | Business Event | Date | Count |
|---|---|---|---|
| Blackrock | Labor_Layoff | 26 March 2017 | 0 |
| Blackrock | Labor_Layoff | 27 March 2017 | 0 |
| Blackrock | Labor_Layoff | 28 March 2017 | 46 |
| Blackrock | Labor_Layoff | 29 March 2017 | 39 |
| Blackrock | Labor_Layoff | 30 March 2017 | 6 |
| Blackrock | Labor_Layoff | 31 March 2017 | 3 |
Then we split that master table into hundreds of thousands of small tables, specifically for each company/business event. Like this:
Blackrock/ Labor_Layoff, article day-count.
| Date | Count |
|---|---|
| 27 March 2017 | 0 |
| 28 March 2017 | 46 |
| 29 March 2017 | 39 |
We then look at moments when business events appear as new stories – coverage for the business event appearing after a quiet period.
| Date | Count |
|---|---|
| 27 March 2017 | 0 |
| 28 March 2017 | 46 |
| 29 March 2017 | 39 |
The upper 10% of the days, those are the Significant Business Events for Blackrock and the business event Labor_Layoff. Those are the days for which we calculate the average forward stock return and the volatility.
Volatility
The rule of thumb is that the volatility for a three-day holding period is 1.73 times [that’s the square root of 3) higher than for an individual day. For each business-event we analyze the market adjusted return for the relevant holding period, i.e. the 3 days, following the significant business event. We then compare the standard deviation for those returns, on a company-specific basis, with the 1.73 [sqrt(3)] times the daily standard deviation for the same stock.
We show RAISED_VOLATILITY in the table if the standard deviation of three days following the event is significantly higher.
De-duplication
Overnight we run language clustering processes which make it possible for a user to exclude duplicates when looking at a list of articles.
That function is available in several places in Comvix, including the bottom right quadrant chart of Event Trader.
However, the bottom left corner of the Event Trader show raw article counts. The de-duplication is not available for those articles.
Filtering the Events by Sector
Some traders specialize in a particular sector, for instance healthcare companies. They can select the HEALTH in the filter field at the top left. It’s possible to select several sectors.
Only events for companies matching the sector filter will be displayed.
Filtering by Event-Class
Some traders specialize in certain events, for instance litigation. They can filter by high-level event-classes. It’s possible to select multiple high-level event classes.
Filtering the Events by Sector and by Event-Class
It’s also possible to filter by a combination of Sector and Event-Class, for instance that the Event Trader should only show Financial events and only for the TECHNOLOGY sector.
General
Sectors
We use a proprietary two-level sector taxonomy.
- Agriculture
- Apparel, Fashion, Clothes & Shoes
- Banking, Financial Insurance Services
- Business Services
- Chemicals
- Construction & Engineering
- Materials
- Energy
- Food, Beverages, Tobacco
- Health
- Household & Personal Goods
- Industrial
- Media
- Mining
- Real estate
- Retail
- Telecommunications
- Technology
- Transportation
- Tourism, Restaurants, Leisure
- Utilities
- Non-Governmental Organization
- Intergovernmental organizations
Stock returns
Unless otherwise indicated we generally use Close to Close, adjusted with the S&P 500 return, with a beta = 1.